Memory management in modern languages is often an afterthought. For all intents and purposes, we write software without nary a thought about memory. This serves us well but there are always exceptions…
In California, there are extensive financial reporting requirements for Local Education Agencies (LEA), an LEA can be a county, a district, a charter or a single school. Most LEAs create their own financial reports which are usually centered around Excel, it’s no surprise when each report is different. To solve this problem the California Board of Education commissioned software to generate financial reports.
I was a part of the development team.
My first stop was the testing logs, Ed-Pro’s logs pointed to high memory usage, perhaps there was a memory leak? An engineer observed that Ed-Pro’s calculations used a large amount of short-lived memory. If the memory wasn’t cleaned up quickly, it could appear like a memory leak.
Ed-Pro is built on top of .Net Core, Microsoft’s multi-platform framework. In .Net Core, memory is divided into three tags: Short-lived (Gen0), medium lived (Gen1), and long-lived (Gen2). Gen0 is for short-lived data that quickly goes out of scope, Gen1 is for medium lived memory that hangs around for a bit longer, it too also eventually goes out of scope and Gen2 is long-lived memory that may live for the life of the application. Gen0 memory is constantly reclaimed, Gen1 is reclaimed less frequently than Gen0, and Gen2 is reclaimed even less frequently than Gen1.
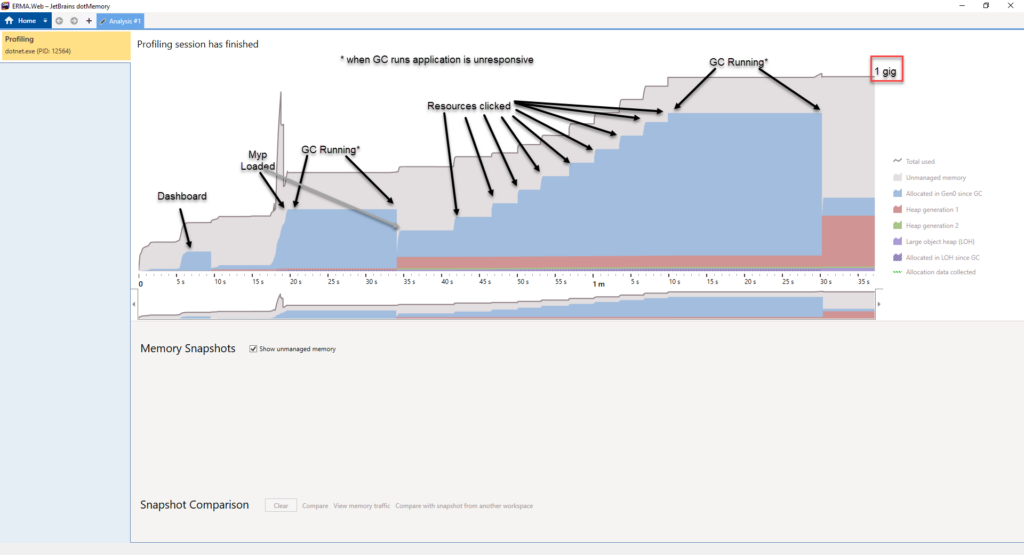
The only sure way to understand the memory usage of Ed-Pro was to profile it, below is a screenshot using dotMemory by JetBrains.
 As suspected, we found large amounts of Gen0 memory (the blue), so much so, it appeared that Garbage Collection couldn’t keep up. A strategy to compensate for a large amount of memory, caused Garbage Collection to oscillated between increasing memory space (adding more memory for the application’s use) and cleaning it up. During the cleanup cycles, the application is unresponsive.
At first, we were stumped, isn’t the purpose of the GC to keep memory tidy? Two articles were instrumental in our understanding of how Garbage Collection works in .Net: Mark Vincze’s article Troubleshooting high memory usage with ASP.Net Core on Kubernetes and Fundamentals of Garbage Collection by Microsoft. Both are great reads and brought clarity to the memory usage in Ed-Pro.
Here’s a summary of what we learned, there are two types of Garbage Collection in .Net: Server Garbage Collection and Workstation Garbage Collection.
Server Garbage Collection makes a couple of assumptions: First, there is ample memory available and second, the processors are multi-core and are fast. Both can be true, but we live in a world of virtual machines and Docker where it’s more likely that both assumptions are false.
Server Garbage Collection allows memory to build, at some point, it does one of two things: it either increases the memory space allowing memory to grow or it frees up orphaned memory. When it chooses to free memory, the Garbage Collection starts the process on a high priority thread. The high priority thread is a higher priority than the application; if the machine is fast, the clean up shouldn’t be noticed. However, if it’s not, it’ll cause the application to halt until the clean up is completed.
Workstation Garbage Collection operations differently. It continuously runs reclaiming memory on a thread with the same priority as the application. This means it’s also competing for resources with the application which can cause application slowness. The upside is the application’s memory usage can stay quite low, primarily when it uses large amounts of Gen0.
As a default, if .Net Core detects a server, it runs the Server Garbage Collection type, which was the case with our application. To run the Workstation Garbage Collection type add the following snippet to your project file:
  <PropertyGroup>
    <ServerGarbageCollection>false</ServerGarbageCollection>
  </PropertyGroup>
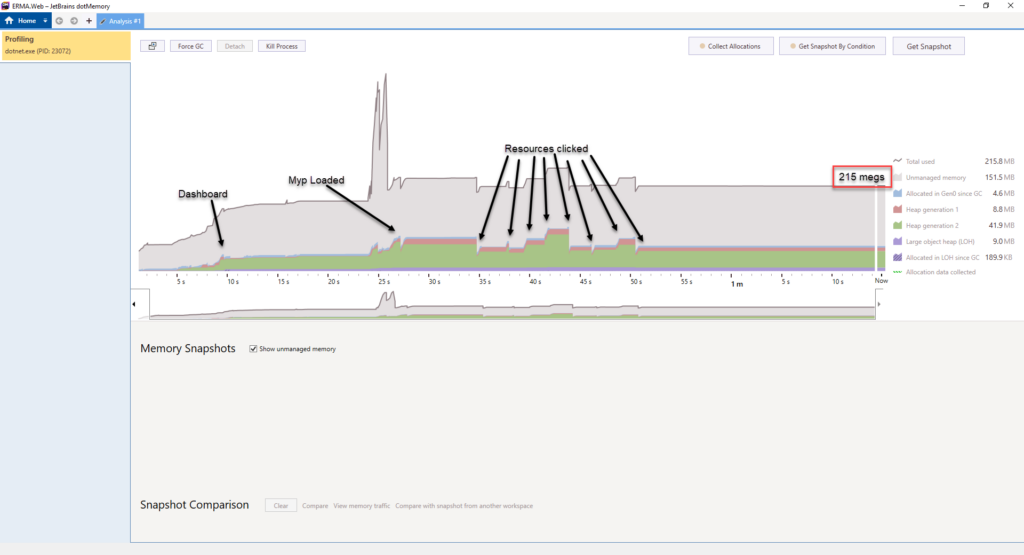
We made this configuration change to Ed-Pro, using dotMemory, we profiled Ed-Pro’s memory with Workstation Garbage Collection enabled and loaded the same screens as in the previous test. Here are the results:
 The memory usage is significantly decreased. The Gen0 allocations are virtually non-existent. Beyond the differences in the graph, the Server Garbage Collection memory usage topped 1 gig while the Workstation Garbage Collection topped at roughly 200 megs.
Every application is different. Our application used a ton of temporary data and thus uses a ton of Gen0 memory. Your application may leverage longer lived memory such as Gen1 or Gen2 in which Server Garbage Collection makes a whole lot of sense. My advice is to profile your memory under different conditions for an idea of how memory is used and then decide which mode is best for you application.